XUNIFY was developed as a performance debugger for the DSM system, Unify. Performance debugging is the process of correcting performance problems in parallel programs that run correctly but does not make maximum use of the available computational resources. In order to help application programmer understand the performance problems in his application Xunify provides a variety of graphical displays of the program execution. These views are namely Space-Time view, Network view, Event filtering view, Utilization view, Percent Utilization view, Task output view and Trace output view. These views will help understand the performance bottlenecks in the application program and tune his application for higher performance. This tool can also be integrated with the Unify system so that Unify applications can be run from the tool itself and the trace data be collected. The tool processes trace data on-the-fly and the trace masks can be changed while the application is still running. Also the trace data collected is written out into a trace file which can be played back any number of times. Xunify was developed as modification of XPVM a performance monitoring tool for the message passing system PVM. Also this tool adapts the tracing facility provided by PVM to generate trace messages. The tool is being developed using C and TCL/TK.
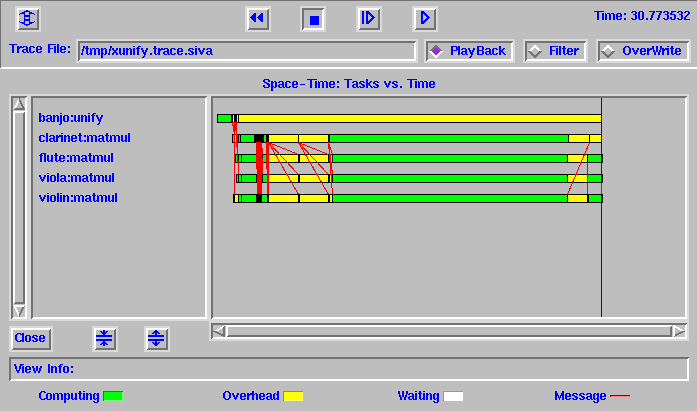
The space-time view represents the execution of the application program with time on the horizontal axis and the hosts on the vertical axis. This is shown in figure below. This view helps us understand how the cooperating processes run on the Unify system. In this view we can see all the unify tasks that are running and the host on which they are running. Each unify worker is represented by a bar. The bar can have any of the following three colors - green, yellow, white. A green color represents that the worker is computing, the yellow color indicates that the worker is communicating or accessing some system services and a white color indicates that the worker is blocked on synchronization. Also the hosts are shown in a sorted order to get an idea of any disproportionate load on any of the host. The Unify workers communicate using the Put_Updates and the Get_Updates calls. These sending and receiving of messages between the workers are shown by red arrows drawn from the sender to the receiver.

Apart from representing how the different workers interact along the time axis, this view also provides information about the different Unify events the user application uses. These event traces make up the bar that represents the execution of a worker. The horizontal bar consists of a series of small rectangles which correspond to Unify events. Clicking on these bars or the arrows between the bars gives a more detailed information about the type of event (like Get_Updates, Put_Updates etc), how long it took for the event and what are the values of the key parameters that were used to make the call. The total time of the trace which indicates the total time the application has run is indicated in the left side just above the window. The elapsed time which is the time the particular event the mouse is over is indicated below the window. Also zooming in and out is possible for the view to get a detailed idea.
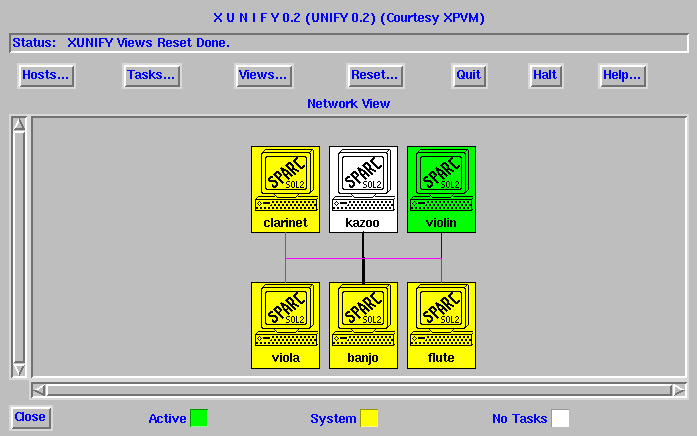
This view shows the different hosts that make up the configuration. The hosts are shown connected by a simple bus irrespective of the underlying network topology. The hosts are represented by ions that includes the architecture name. The Figure below shows a snapshot of a network view.

The network view animates when the application runs.According to the state of the host the icons are colored. At any time a green color indicates computing, an yellow indicates overhead and white indicates that there is no task on this host. Also the thickness of the line connecting the host also varies depending on the network bandwidth that was realized in the last message sent or received. This gives an idea of the network utilization that was achieved by the application.
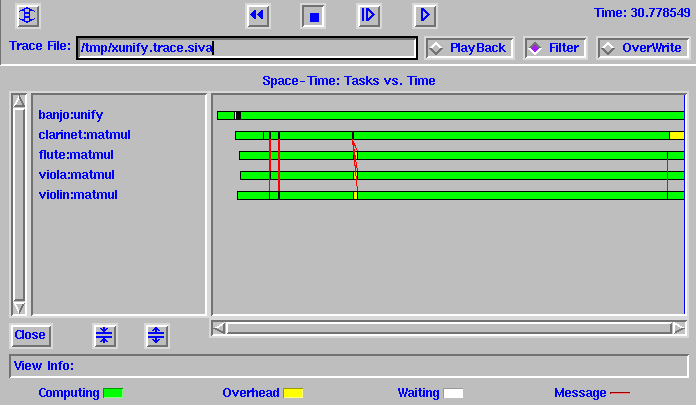
This view shows events that took place in a particular segment or a set of segments. This view can be used during post-mortem analysis when we play back the trace file. Once the application has finished running, during playback analysis the user can specify a set of segment which are of prime interest to him and then rerun the trace after turning the filter button ON. This will filter and show the events only on that particular segments selected by the user. Figure below shows an event filtering view.
